Q&A


How to Start Using the Detector Method

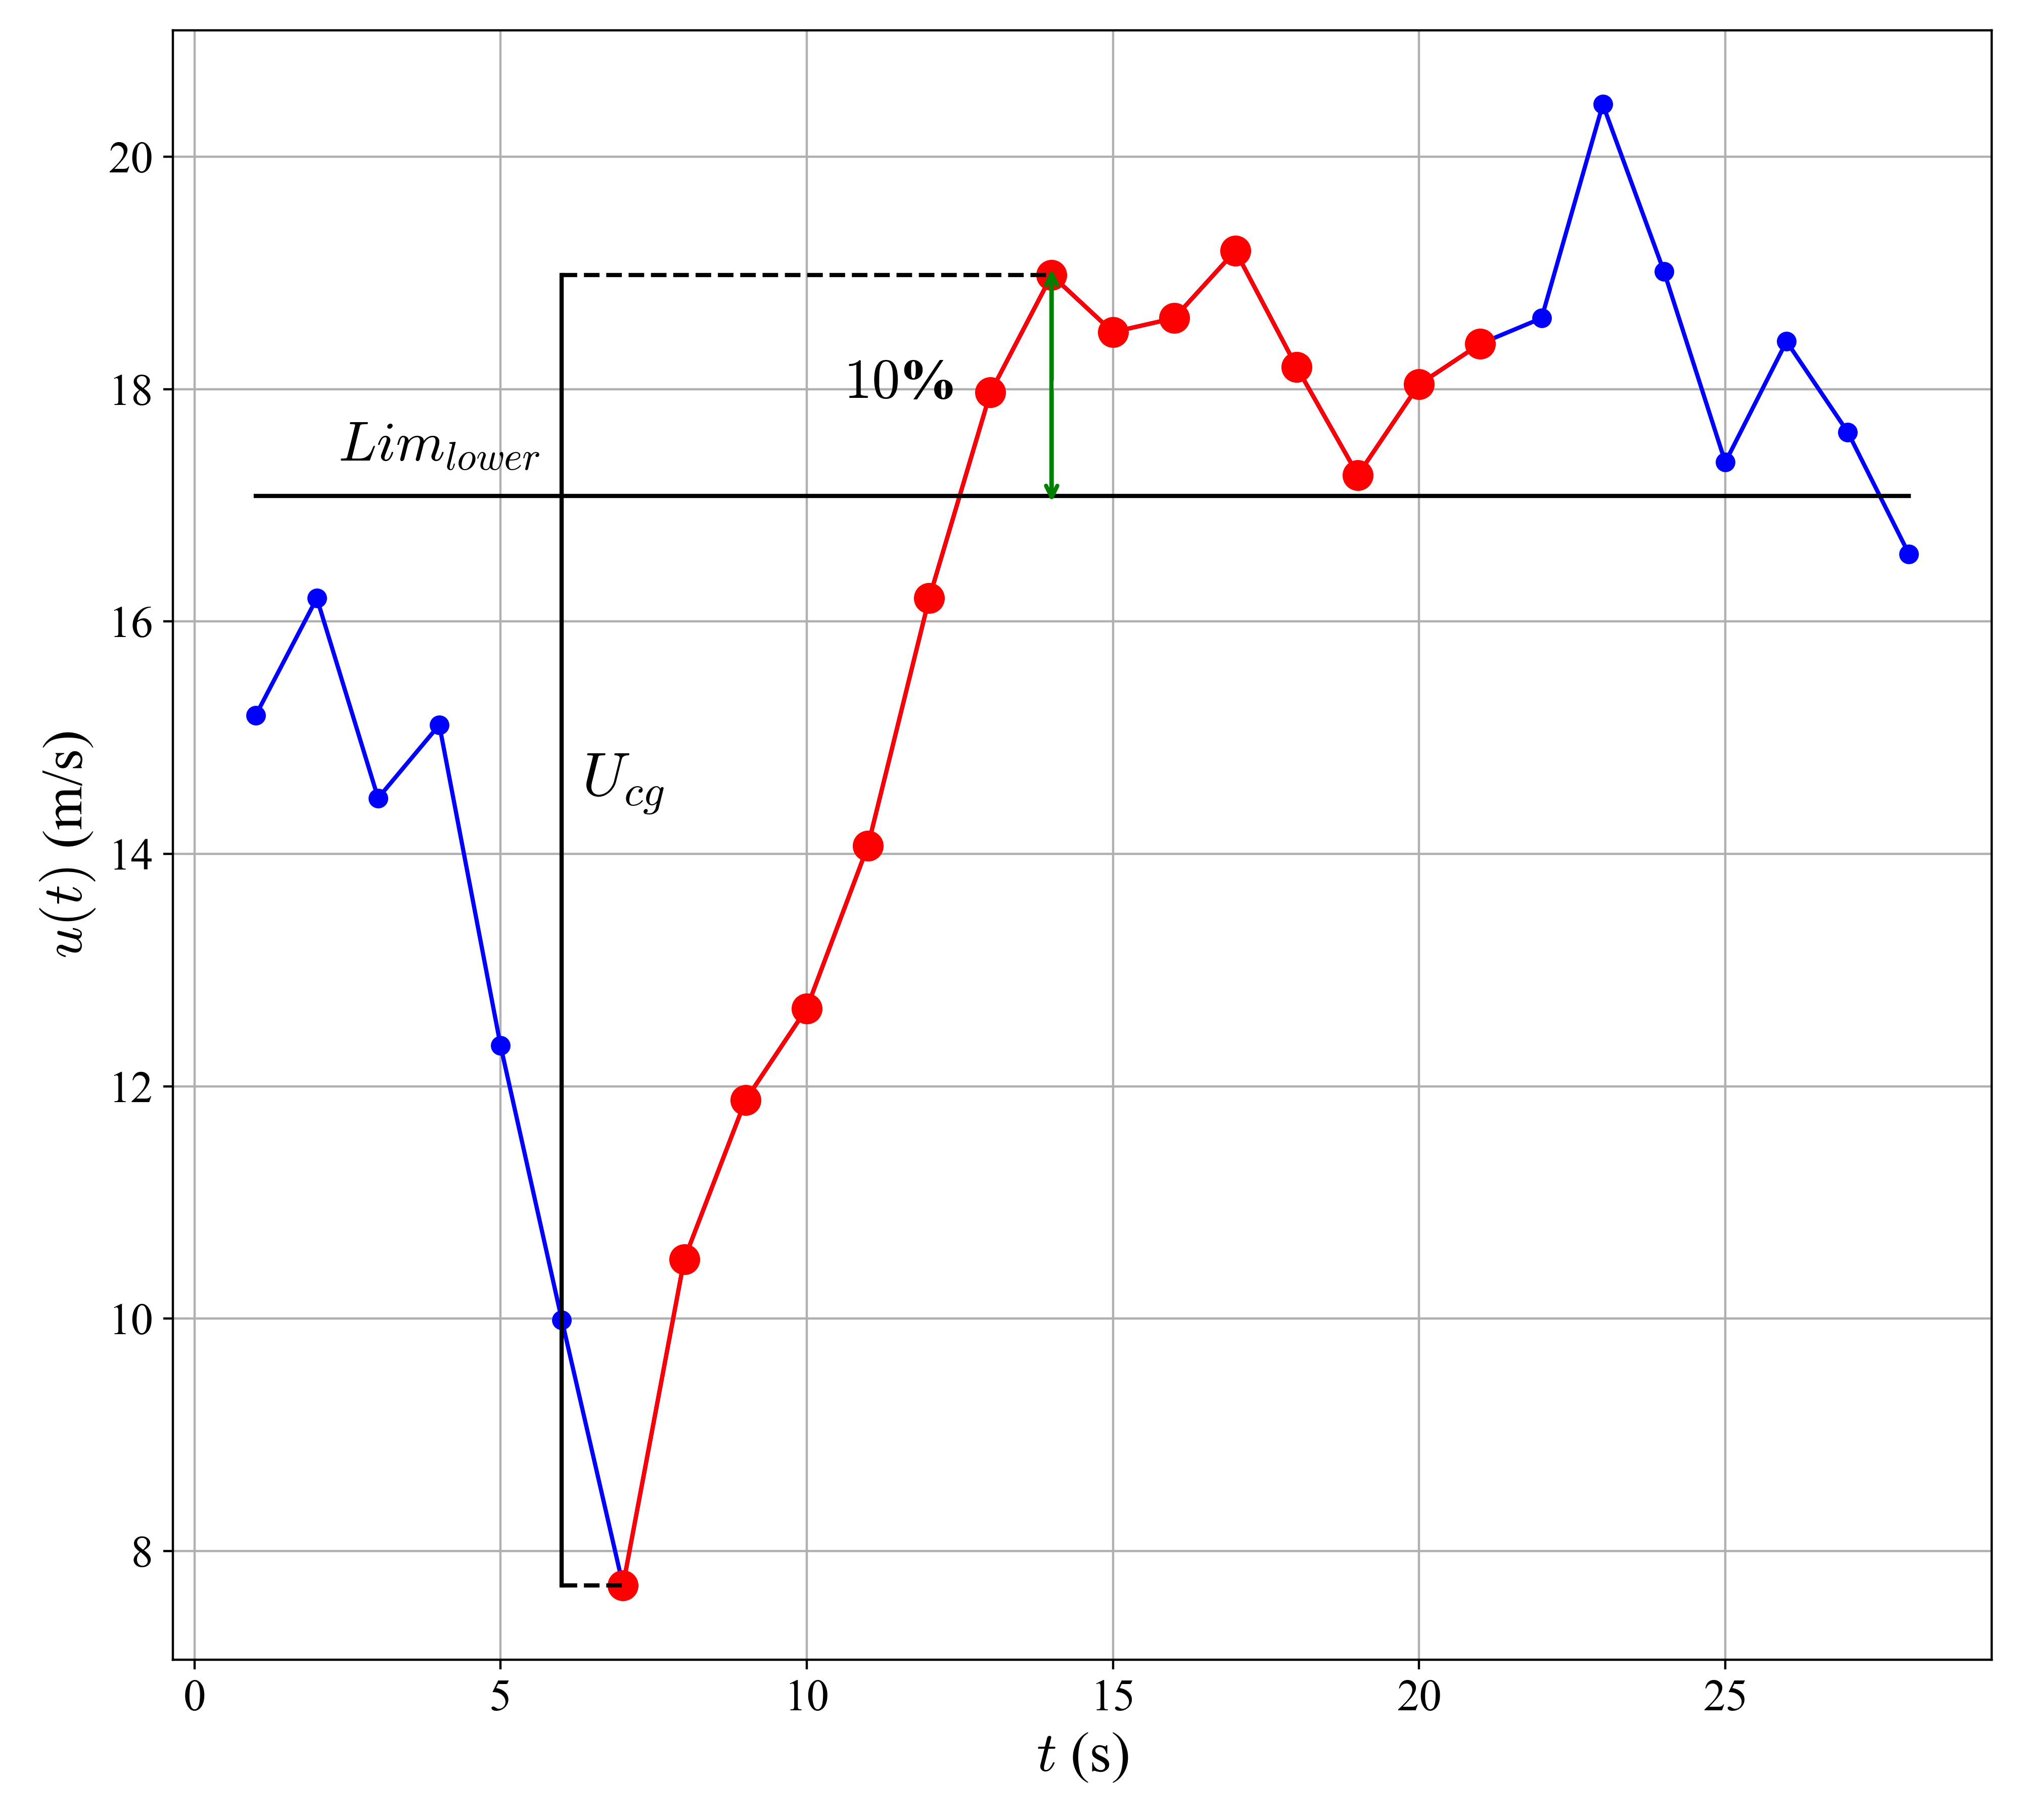
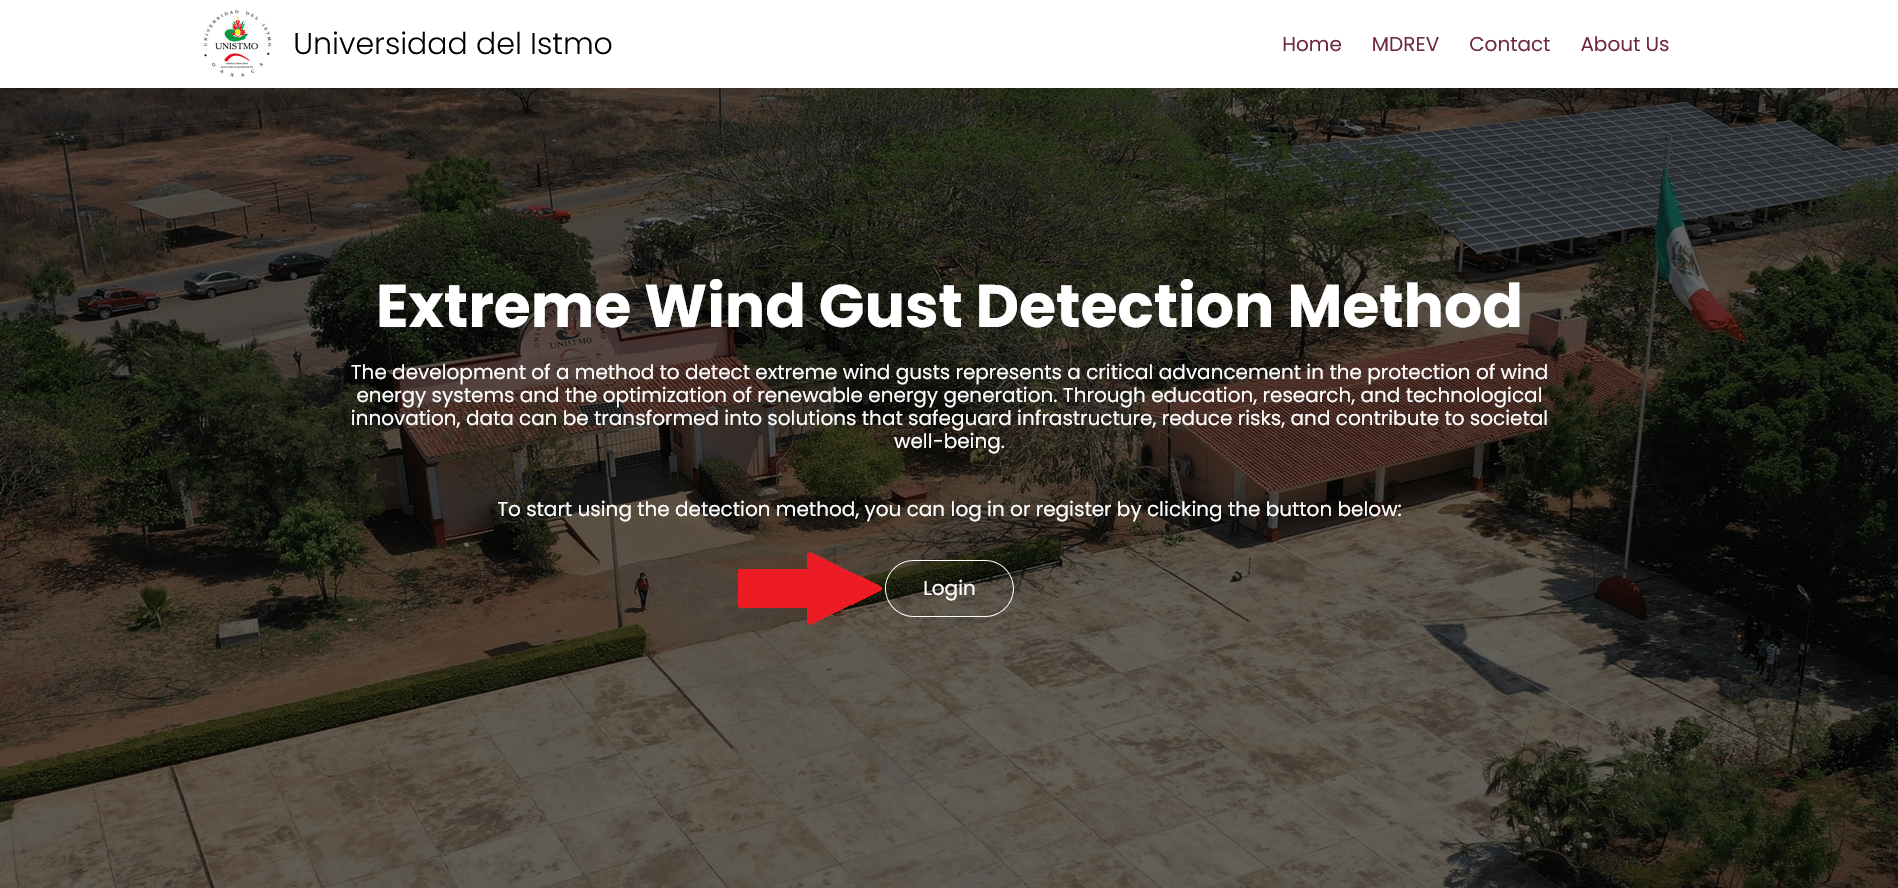
How do I log in or register?

1.- Before using the detector method, you must log in by clicking the "Login" button on the homepage.


Example

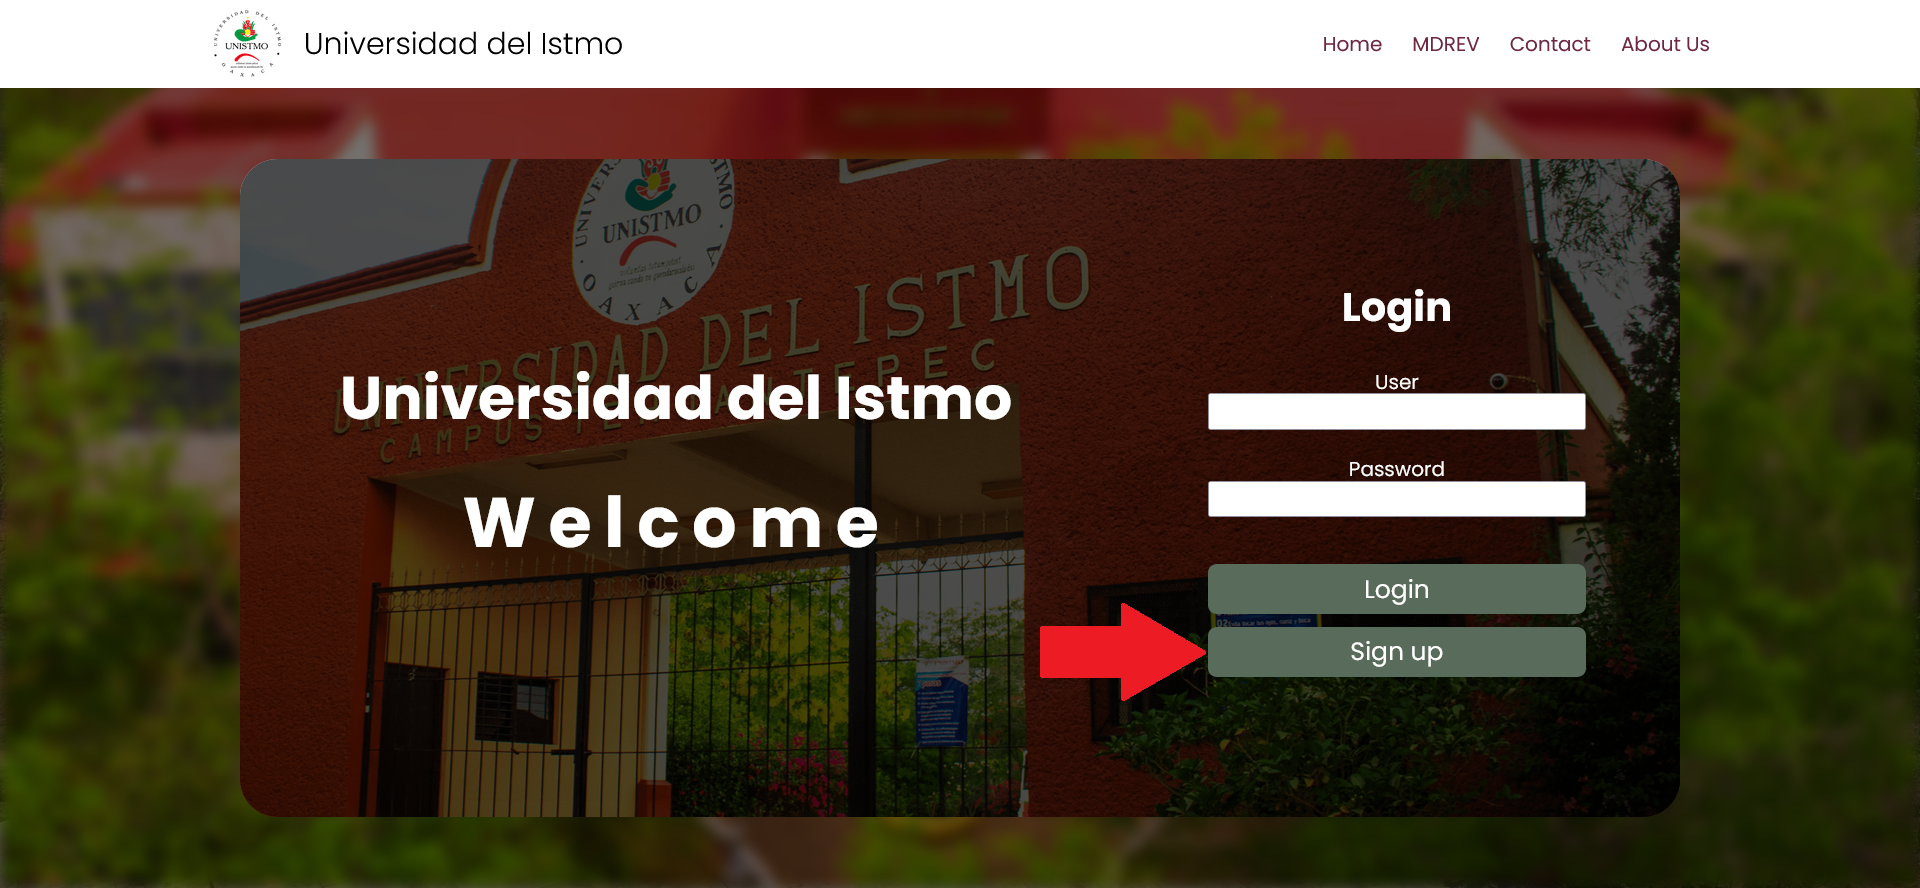
2.- If you do not have an account yet, you can create one by clicking the "Sign Up" button.


Example

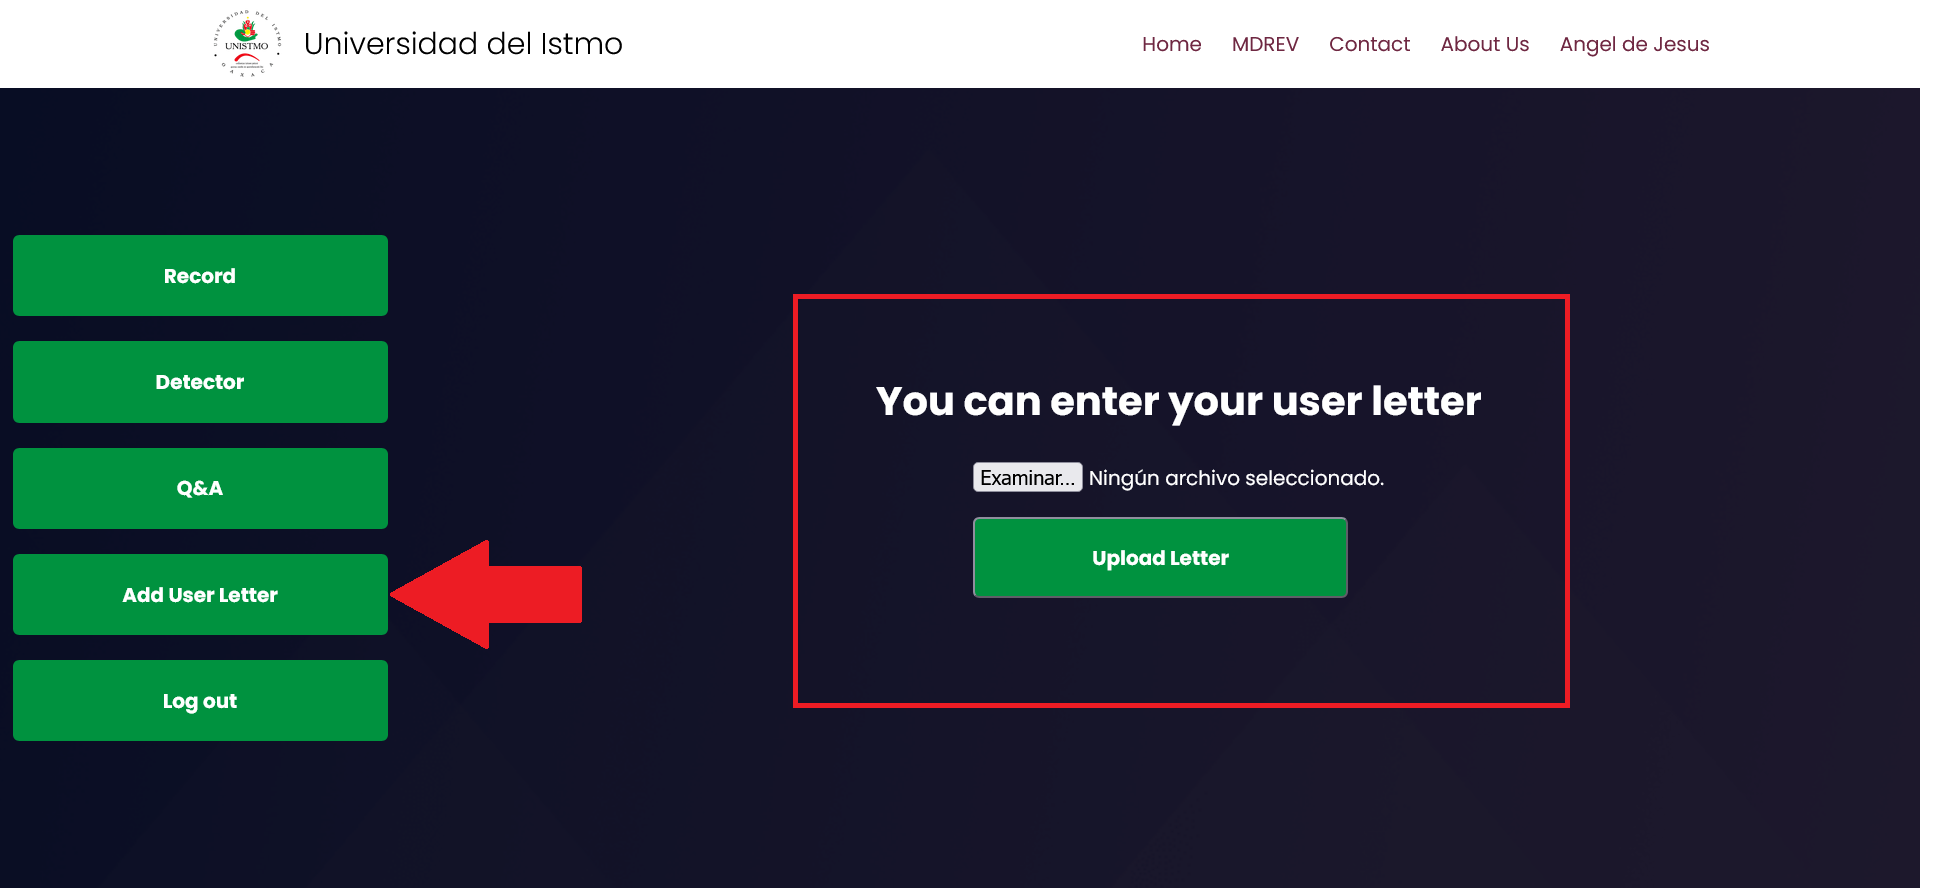
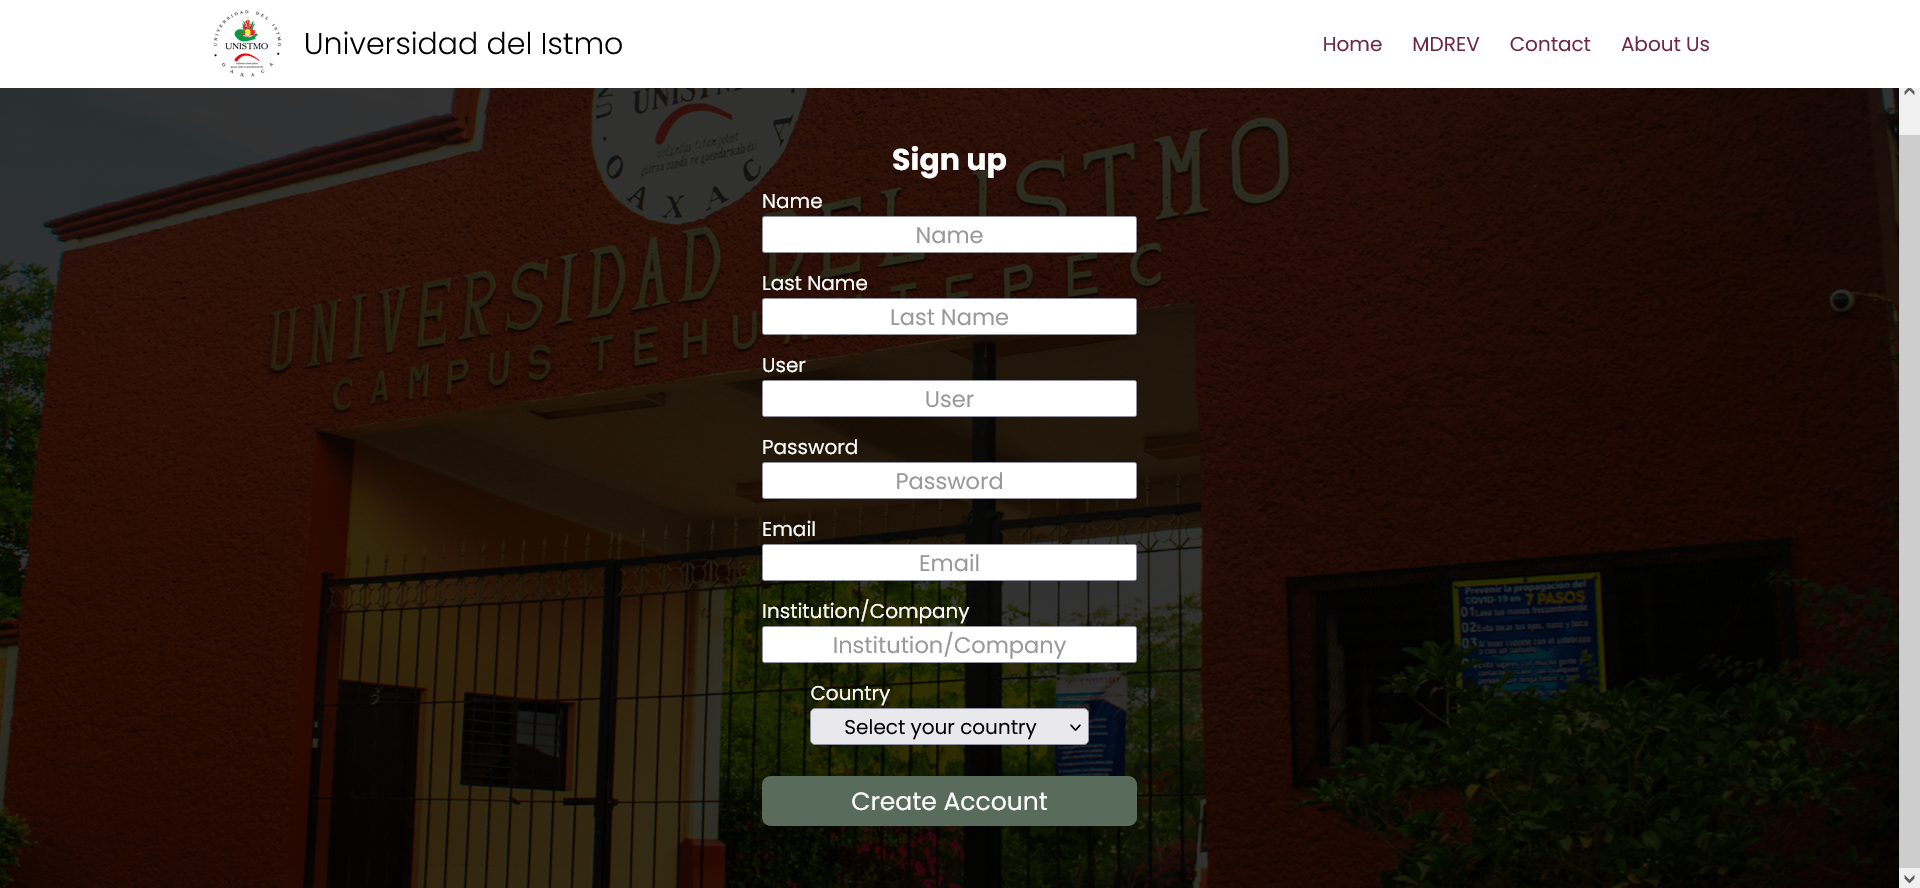
3.- To complete your registration, fill out the form. You will receive a confirmation email along with a template for the user letter.


Example

4.- Once registered, enter your username and password, then click the "Login" button.


Example

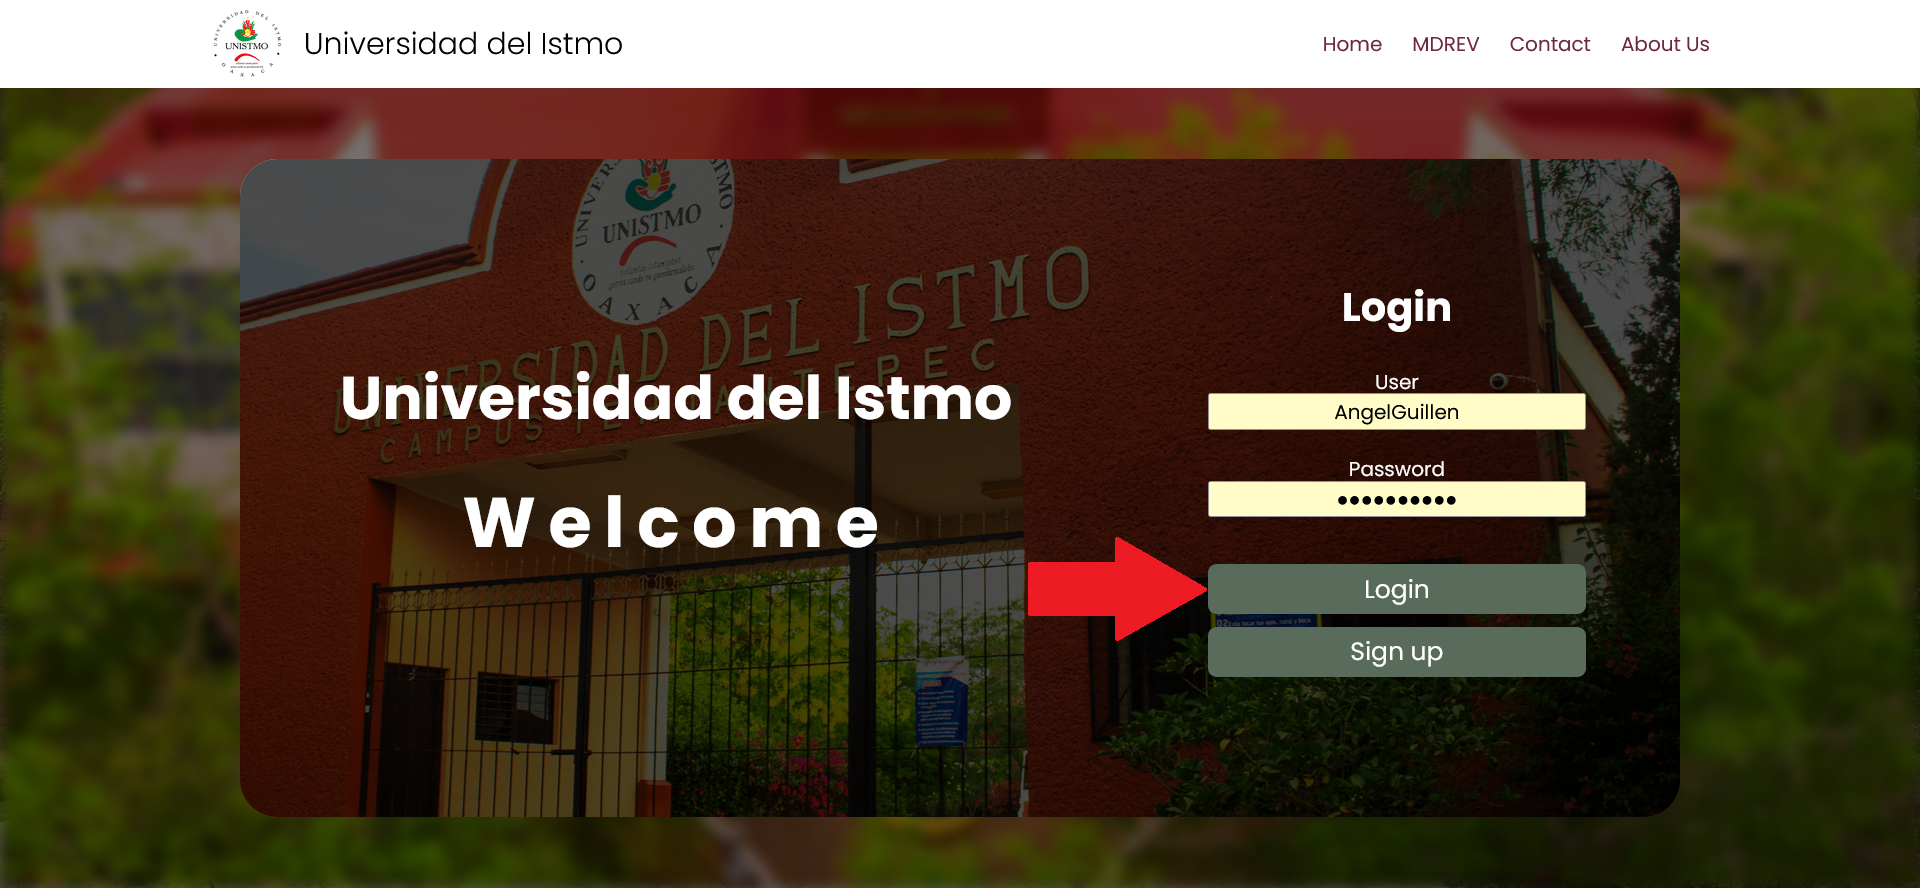
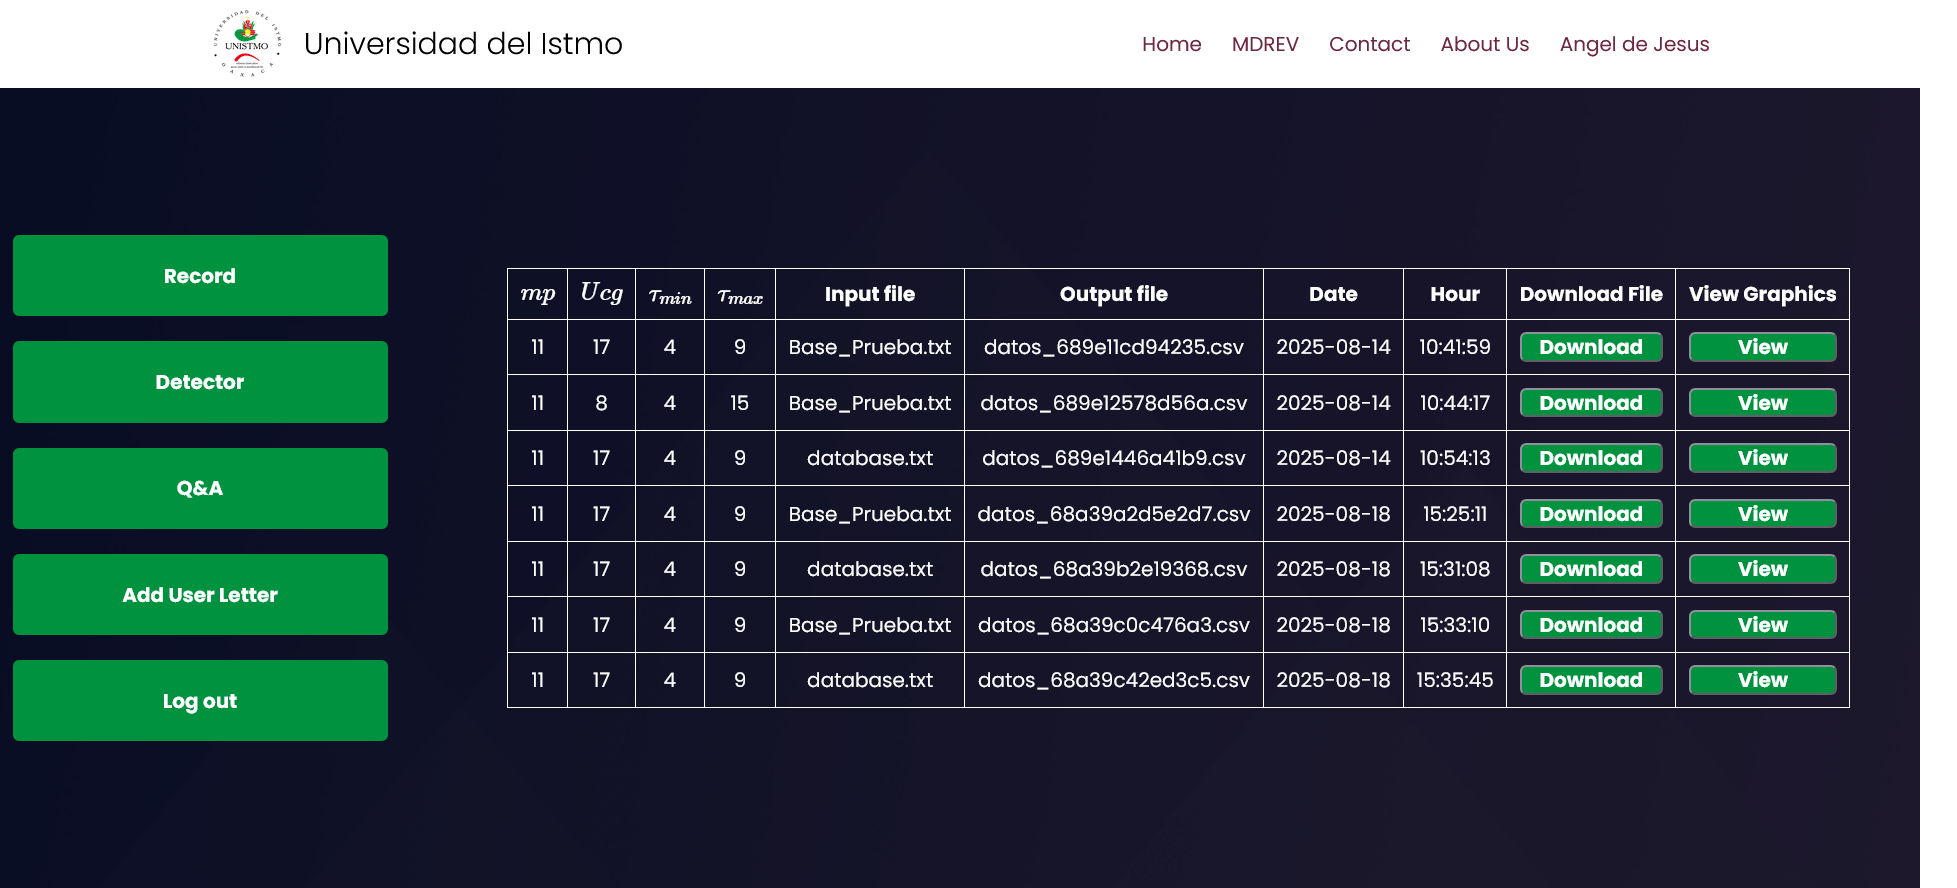
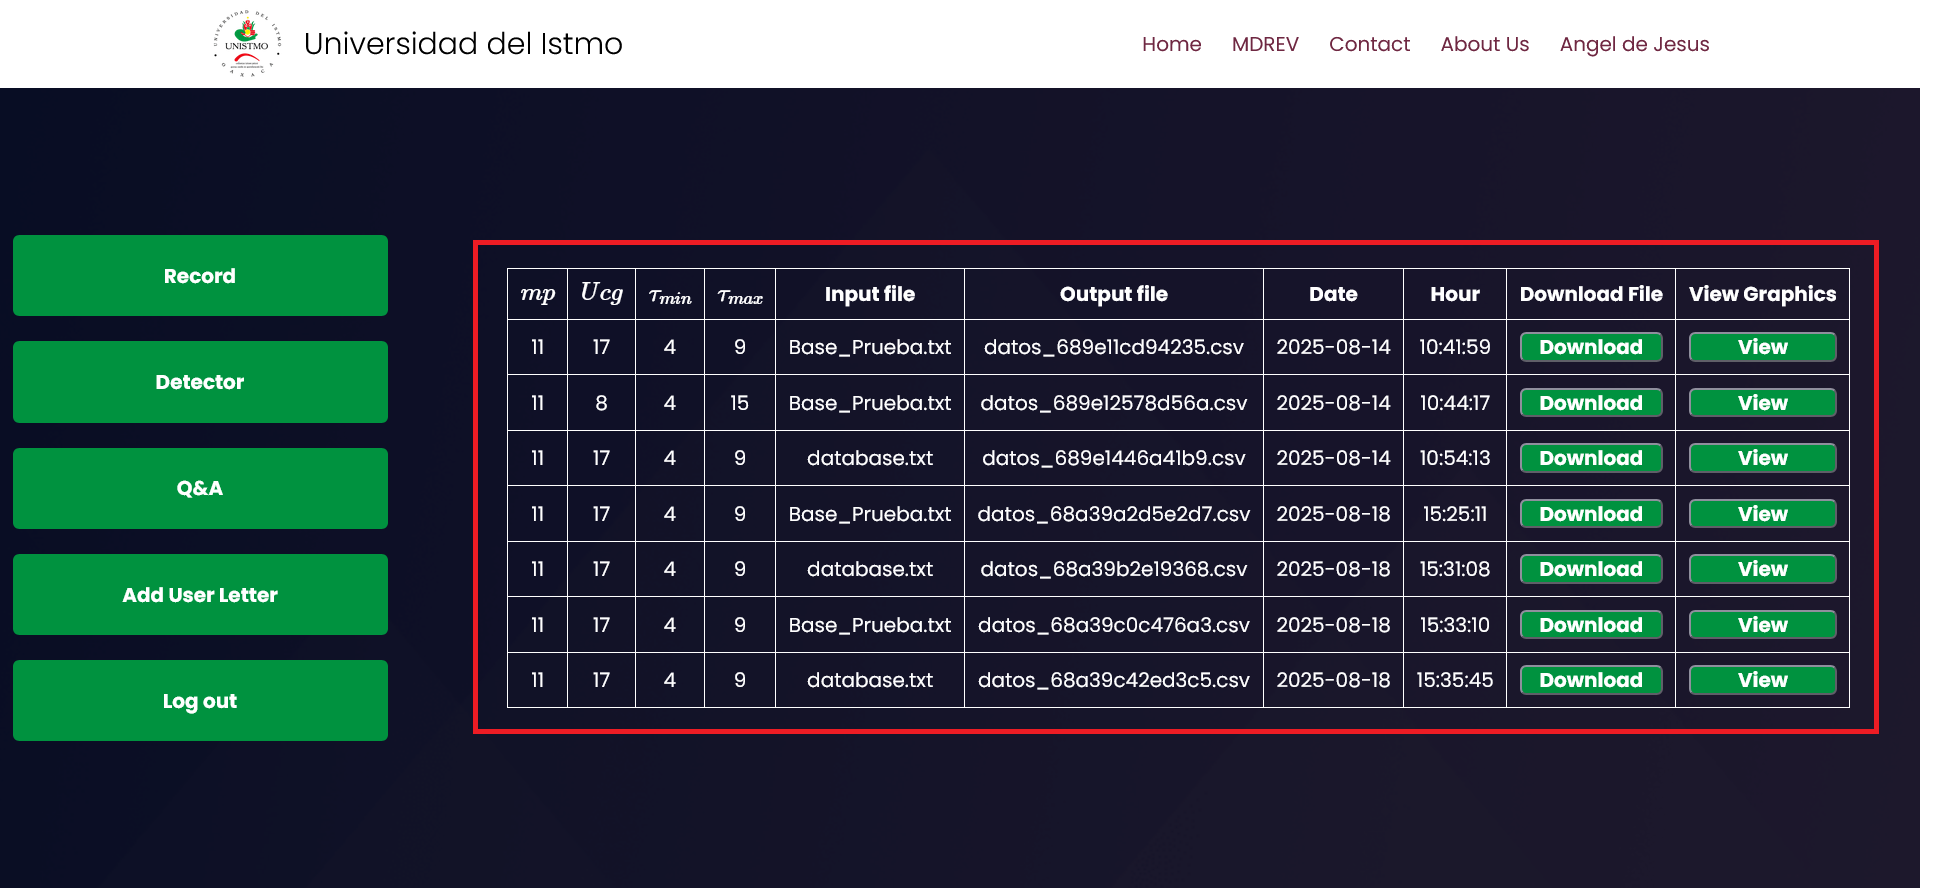
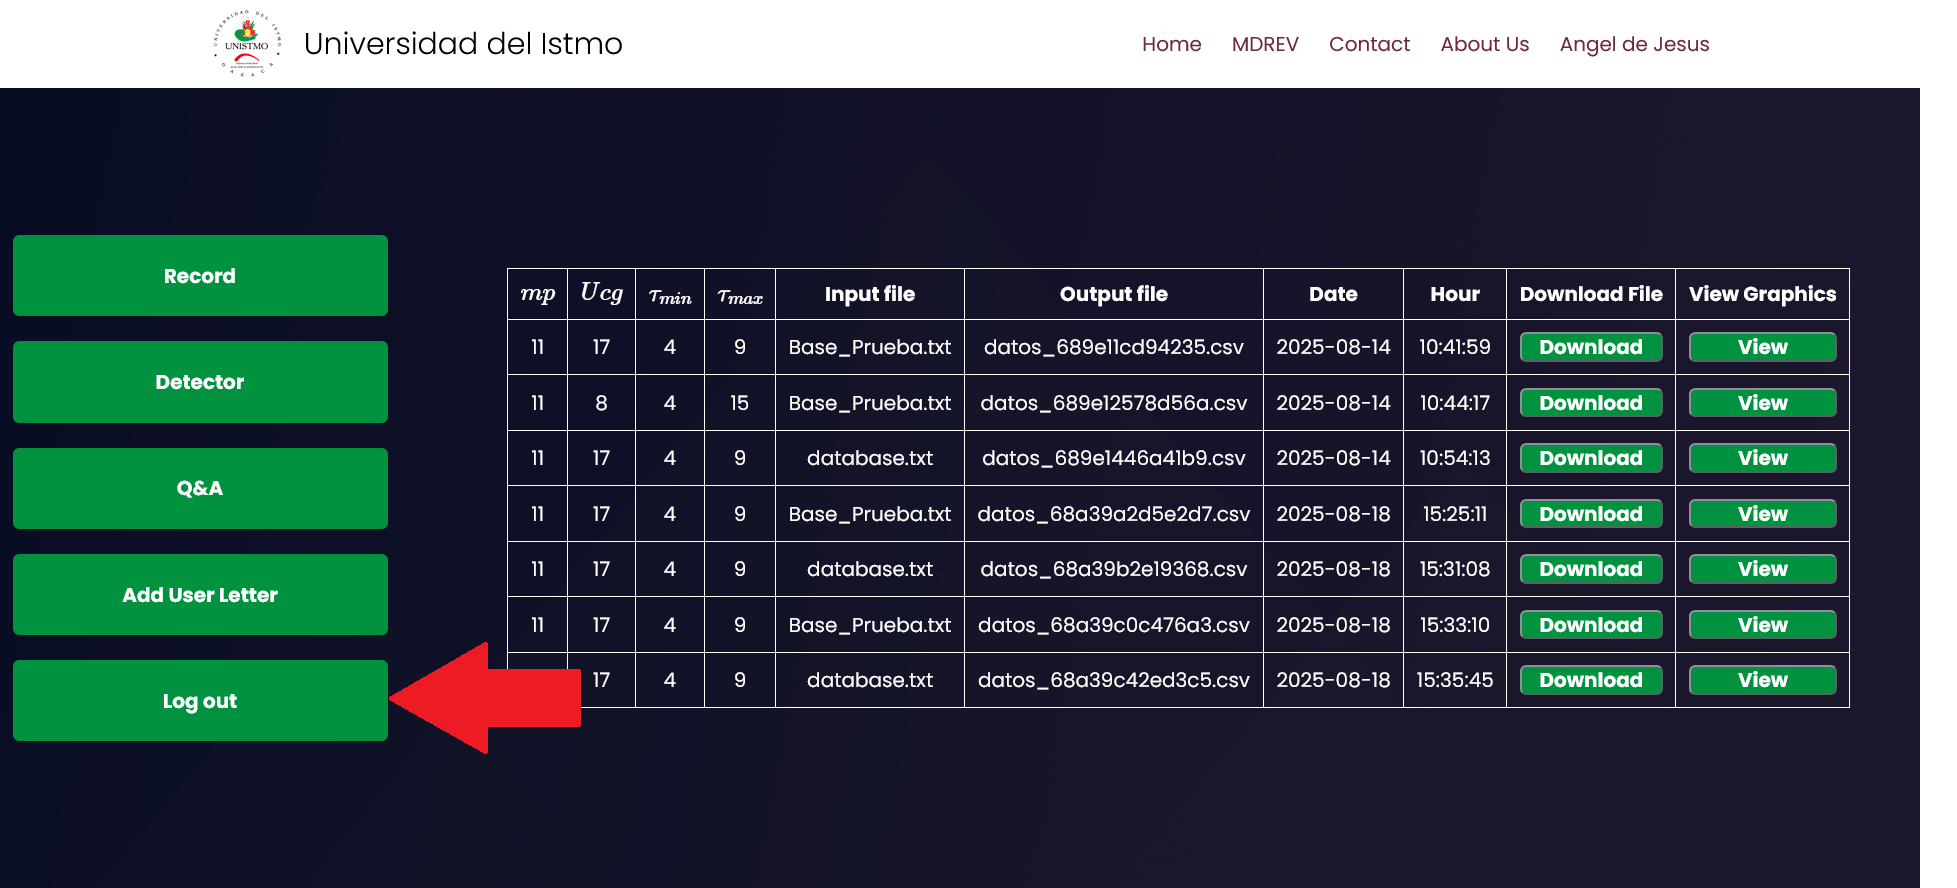
5.- If the login is successful, you will be redirected to the Dashboard.


Example

How to use the Dashboard?

On the main Dashboard page, you will see a record of all previous analyses. By clicking the "Download" button, you can download the .csv file for that specific analysis if needed. Clicking the "View" button will generate a gallery displaying the gusts detected in that particular analysis.


Example

The "Detector" button will take you directly to the detector tool.


Example

By clicking the Q&A button, you will be redirected to the page you are currently on.


Example

In the "User Letter" section, you can upload your user letter. Simply select your file (PDF or Word) and click the "Upload Letter" button. If the letter is uploaded successfully or if a user letter has already been submitted previously, a message will appear saying "A user letter has already been delivered."


Example

To log out, just click the "Log Out" button.


Example

How to Use the Detector?

The detector method is easy to use; just follow these steps:

1.- Enter the values for the following variables: \(mp\) , \(U_{cg}\) , \(\tau_{min}\) , \(\tau_{max}\) .


Example

2.- Select a database option. There are two available choices.


Example

If you want to use the local database provided, simply select that option and click "Submit." A window will appear informing you that by using this database for any scientific dissemination, you agree to acknowledge and credit the mentioned project.


Example

If you have your own database to analyze, select the corresponding option. A window will then display the requirements your database must meet to be analyzed correctly.


Example

For analyzing your own database, upload the corresponding .txt file and specify the column that contains the wind speed data.


Example

3.- Once the analysis is complete, you will be redirected to a page showing a gallery of the detected gusts. From this page, you can also download the .csv file containing the detected gust data.


Example

Variables Required for the Analysis

What is the value of \(mp\)?

\( mp \) : Threshold amplitude, measured from trough to peak. Both the Positive Amplitude and the Negative Amplitude must reach or exceed this value for an EOG to be considered present. This value is defined by the user.


Example

What is the value of "\( EOG_{Factor} \)"?

\( EOG_{Factor} \) : It represents the percentage of additional time that may be required for the development of the negative EOG amplitude relative to the time of the positive amplitude.


Example

What is the value of "\( U_{cg} \)"?

\( U_{cg} \) : Threshold amplitude, measured from the lowest point to the highest point. It must be exceeded for an ECG to be considered present. This value is defined by the user.


Example

What is the value of "\( Lim_{Upper} \)"?

\( Lim_{Upper} \) : Corresponds to the upper percentage limit of the velocity range within which an ECG is identified.


Example

What is the value of "\( Lim_{Lower} \)"?

\( Lim_{Lower} \) : Corresponds to the lower percentage limit of the velocity range within which an ECG is identified.


Example

What is the value of "\( \tau_{max} \)"?

\( \tau_{max} \) : Maximum duration interval, in seconds, allowed for the evolution of the Positive Amplitude in the EOG or for the increase of velocity in the ECG.

What is the value of "\( \tau_{min} \)"?

\( \tau_{min} \) : Minimum duration interval, in seconds, allowed for the evolution of the Positive Amplitude in the EOG or for the increase of velocity in the ECG.

Databases

What information is available about the provided database?


Meteorological Station Data


The experimental campaigns were conducted at the test facility of the Instituto Nacional de Electricidad y Energías Limpias (INEEL), located in La Ventosa, in the Isthmus of Tehuantepec region, Oaxaca, Mexico (coordinates: 16°32′40.8” N, 94°57′09.0” W).


Anemometers were installed on a 40-meter tower with the support of technical staff from INEEL and IER-UNAM. Measurements were conducted at two heights, using anemometers positioned at 17.5 and 40 meters above ground level. Both WindMaster 3D devices (see Figure 1) provide outputs of temperature, pressure, and the three wind velocity components at 20 Hz (32 Hz optional). The available database corresponds to the anemometer installed at 40 meters.


The data were measured and recorded at a frequency of 1 Hz, and stored in the database from December 1, 2017, to November 30, 2018. The anemometers have a wind speed range of 0–50 m/s with a resolution of 0.01 m/s.


The anemometers were connected to a CR6 data acquisition and control system (see Figure 2). It provides fast communication through USB and Ethernet ports, as well as a protocol for high-speed data transfer via FTP.

What requirements must my own database meet?

To ensure compatibility, your database must be in .txt format, properly structured, and include a column with wind speed data. Any deviations from the expected format may prevent the detector from analyzing the file correctly.


Requirements for using a custom database:


  • The database must be provided in a .txt file.

  • The detection algorithm is designed to operate with a sampling frequency of 1 Hz.

  • Columns must be separated by a single whitespace character.

  • The file must not include header rows.

  • The required columns, in the specified order, are:

Year Month Day Hour Minute Second Data Index Wind Speed
Integer Integer Integer Integer Integer Integer Integer Float

Example

Additional Information

If you need further clarification regarding the detection method or specific details about the database used, feel free to contact us. We are available to address technical questions, provide additional information, or assist with requests related to data analysis.

Contact us